
00:27:40
Cycling, transport
|
|
12.1km
|
57.9km/h
|
26.5km/h
|
00:02:16
|
|
253kcal
|
402m
|
392m
|
0%
|
3m
|
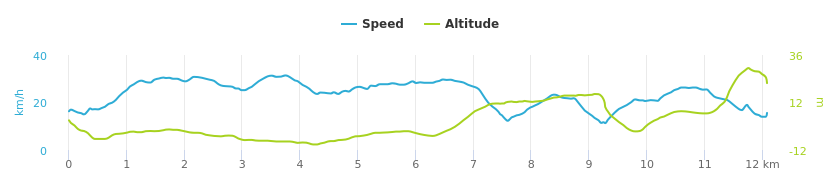
Speed vs Altitude graph
 |
Lap times
| 1 |
02:31
|
| 2 |
01:59
|
| 3 |
02:04
|
| 4 |
01:55
|
| 5 |
02:07
|
| 6 |
01:51
|
| 7 |
01:57
|
| 8 |
02:54
|
| 9 |
02:30
|
| 10 |
02:28
|
| 11 |
02:15
|
| 12 |
02:29
|
| 13 |
00:25
|
Split table
| Distance (km) | Pace | Duration | Avg. speed (km/h) | Altitude (m) |
|---|---|---|---|---|
|
1
|
00:02:31
|
00:02:31
|
23.8
|
-4
|
|
2
|
00:01:59
|
00:04:30
|
30.2
|
-2
|
|
3
|
00:02:04
|
00:06:34
|
29.0
|
-4
|
|
4
|
00:01:55
|
00:08:29
|
30.7
|
-8
|
|
5
|
00:02:07
|
00:10:36
|
28.4
|
-8
|
|
6
|
00:01:51
|
00:12:27
|
32.4
|
-3
|
|
7
|
00:01:57
|
00:14:24
|
30.8
|
-2
|
|
8
|
00:02:54
|
00:17:18
|
20.6
|
12
|
|
9
|
00:02:30
|
00:19:48
|
23.9
|
14
|
|
10
|
00:02:28
|
00:22:16
|
24.4
|
7
|
|
11
|
00:02:15
|
00:24:31
|
26.7
|
6
|
|
12
|
00:02:29
|
00:27:00
|
24.2
|
20
|
|
13
|
00:04:06
|
00:01:41
|
14.6
|
21
|
Comments
There are no comments yet.